
How can I send IO count data to InfluxDB and Grafana?
This FAQ will explain how Node-RED can be used to send data to InfluxDB and how this data can be visualised in Grafana. We will describe fully the example of sending IO count data from the BB-400 to a database in InfluxDB and then we will produce graphical visualisations of this data.
Overview
In industry, it is common to count how often something changes, store the information, and then review and analyse the information in a graph. For example temperature, parts counts, or machine errors. This application provides a simple template to achieve that.
What is Node-RED?
Node-Red is a browser-based application useful for wiring together hardware devices and other services in an easy-to-use way. Node-RED is a programming tool but prior coding experience is not necessary to use it.
What is InfluxDB?
InfluDB is a SQL-like, open-source time-series database. InfluxDB can be used to create query and store data.
What is Grafana?
Grafana is an open-source visualisation tool useful to modify time-series database data into graphs.
Diagram
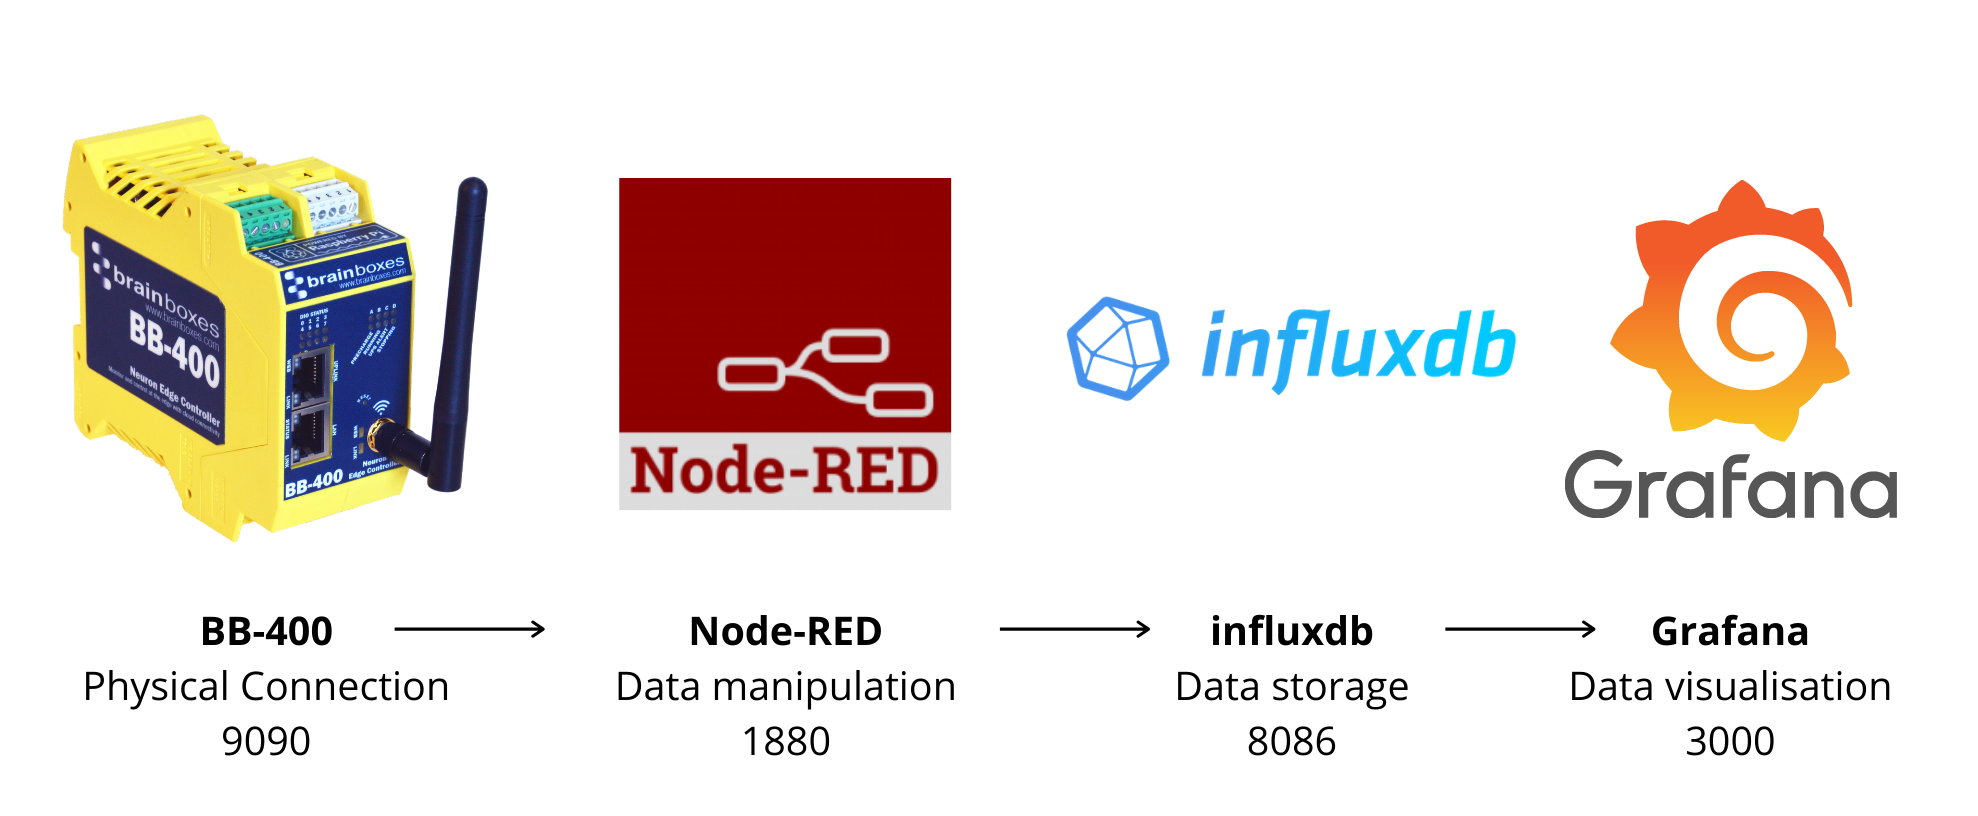
The diagram below shows an overview of each of the applications and their TCP port number:
Software Requirements
You will require:
The following sections will take you through each step ensuring you have access to each of these applications.
Node-RED
On the BB-400 Node-RED is available by default, so you do not have to install it. You can access Node-RED by selecting the Apps tab on the webserver page. The default username is 'bb', and the default password is the last 4 characters of your MAC address:
Installing InfluxDB and Grafana
We have made it easy for you to install InfluxDB and Grafana by combining all the code into one script for you to run. Open up the BB-400 terminal and run the following command to install InfluxDB and Grafana on your BB-400. You can copy and paste this command directly into the BB-400 terminal by firstly copying the line of code, then within the BB-400 terminal running Ctrl+A followed by Ctrl+V:
curl -s https://www.brainboxes.com/files/pages/support/faqs/sample_code/install-grafana-influxdb | sudo bash
NB: The script can take 5-10 minutes to complete.
Running InfluxDB
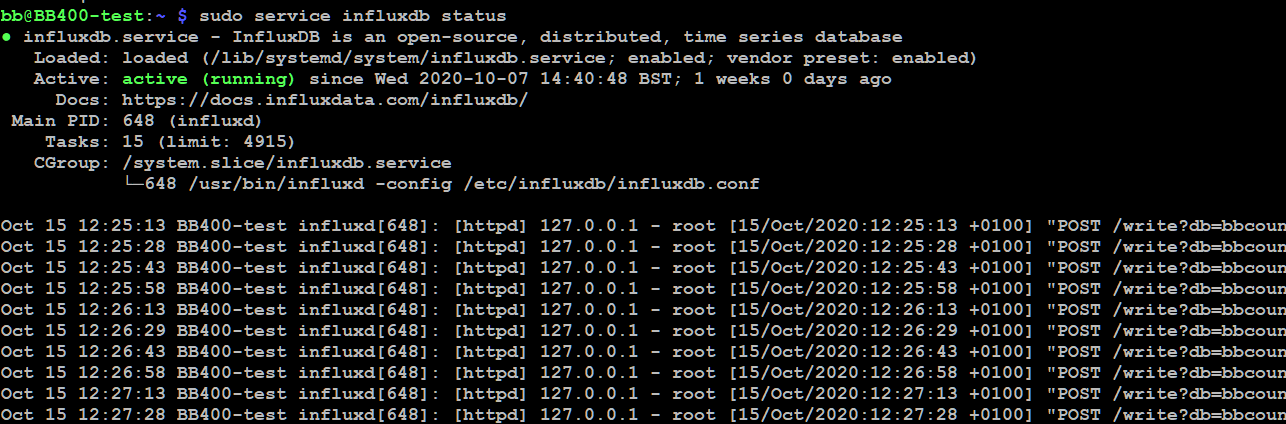
The command in the previous section should have installed InfluxDB onto your device.To check the status of InfluxDB run the following command:
sudo service influxdb status --no-pager
You should see a green "active" status. If the service is not running try:
sudo service influxdb start
And then rerun the command to check the status:
Now when we run the influx command, we can access the service:
influx

To exit InfluxDB:
quit
For further information please refer to the official documentation here: https://docs.influxdata.com/influxdb/v1.8/introduction/install/
Running Grafana
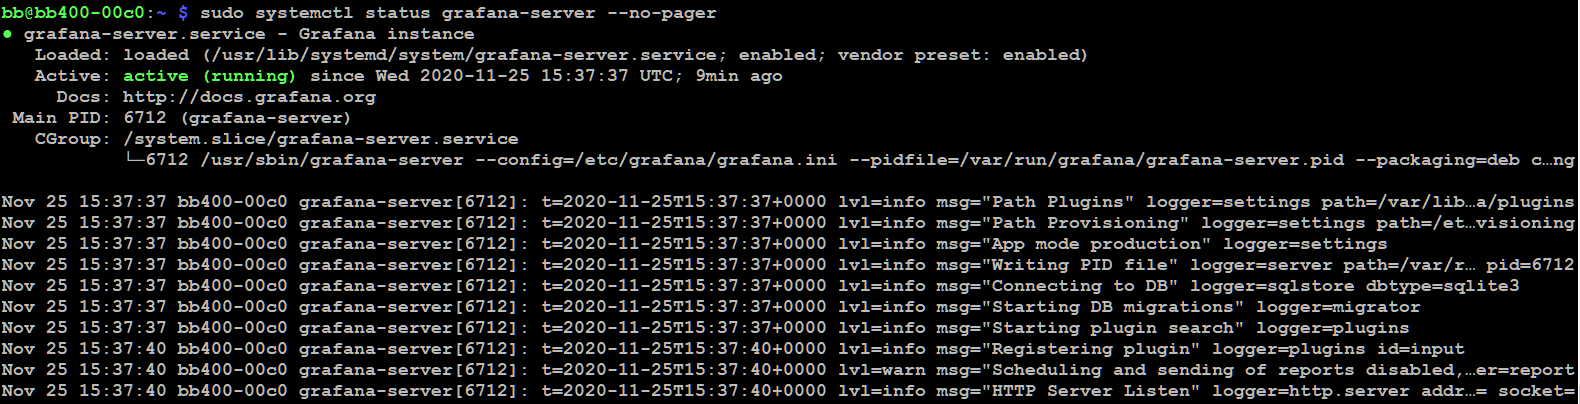
To see the status of the Grafana service:
sudo systemctl status grafana-server --no-pager
You should see a green "active" status. If the service is not running try:
sudo systemctl start grafana-server
And then rerun the command to check the status:
Now we have installed Grafana onto the BB-400 we can log into the service.
Point your browser to: http://DEVICE-IP-ADDRESS:3000/ E.g. for our device we will use: http://192.168.3.145:3000, as you can see in the image below:
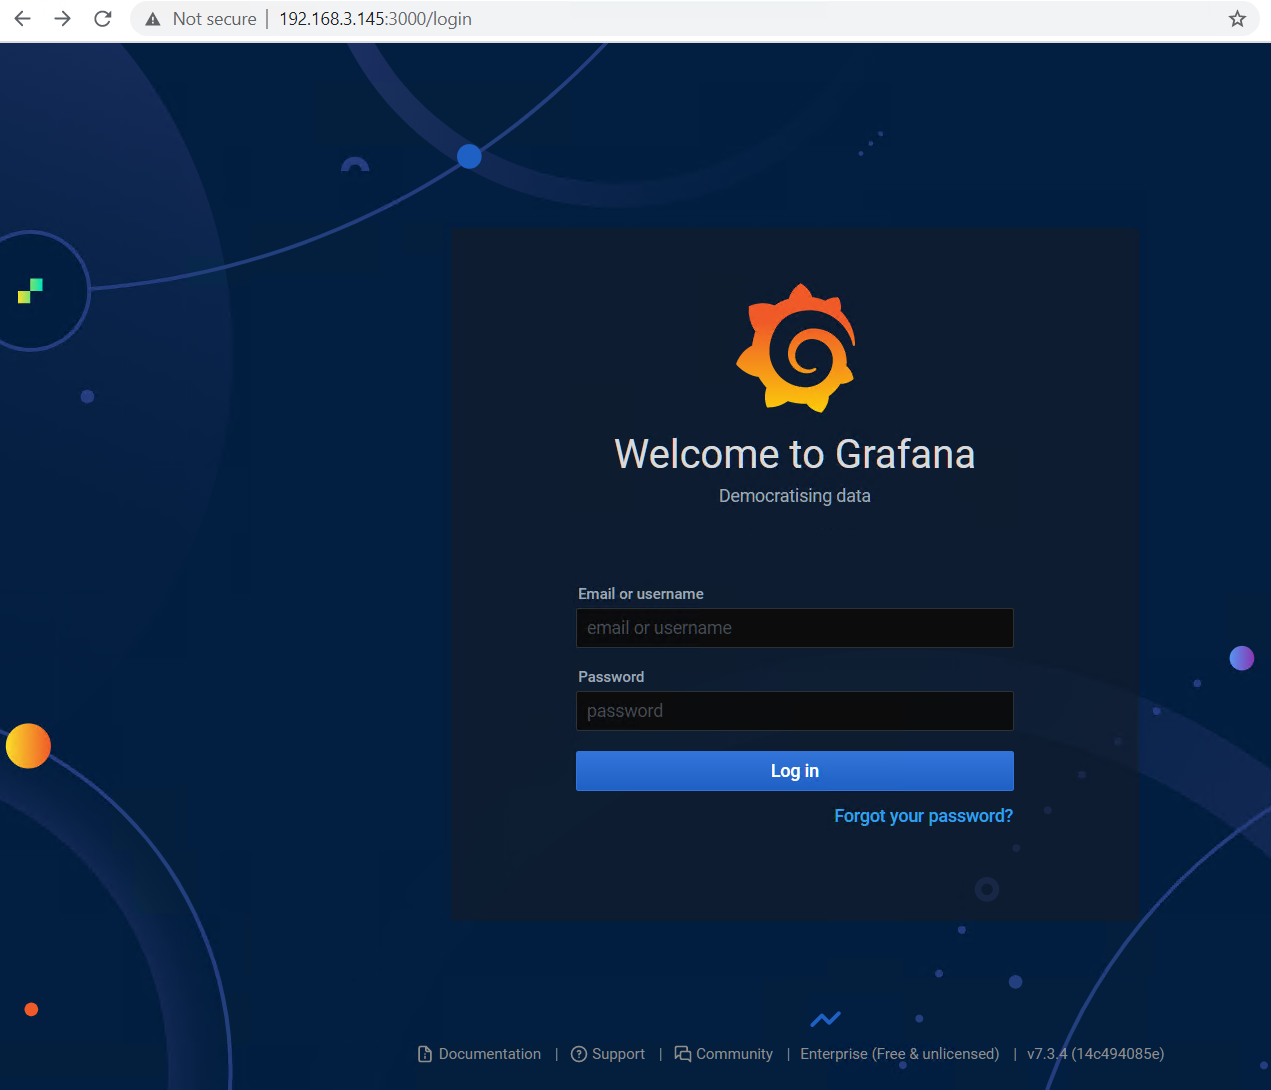
When logging in for the first time, both the username and password are "admin". You will then be prompted to change your password and you have successfully set up Grafana.
For more information please refer to the official documentation here:
- https://grafana.com/docs/grafana/latest/installation/debian/
- https://grafana.com/docs/grafana/latest/getting-started/getting-started/
Recap
By this point you should have Node-RED, InfluxDB and Grafana up and running.Next we will configure Node-RED so that we can send data to InfluxDB and then view this data on Grafana.
Sending data from Node-RED to InfluxDB
Node-RED flow
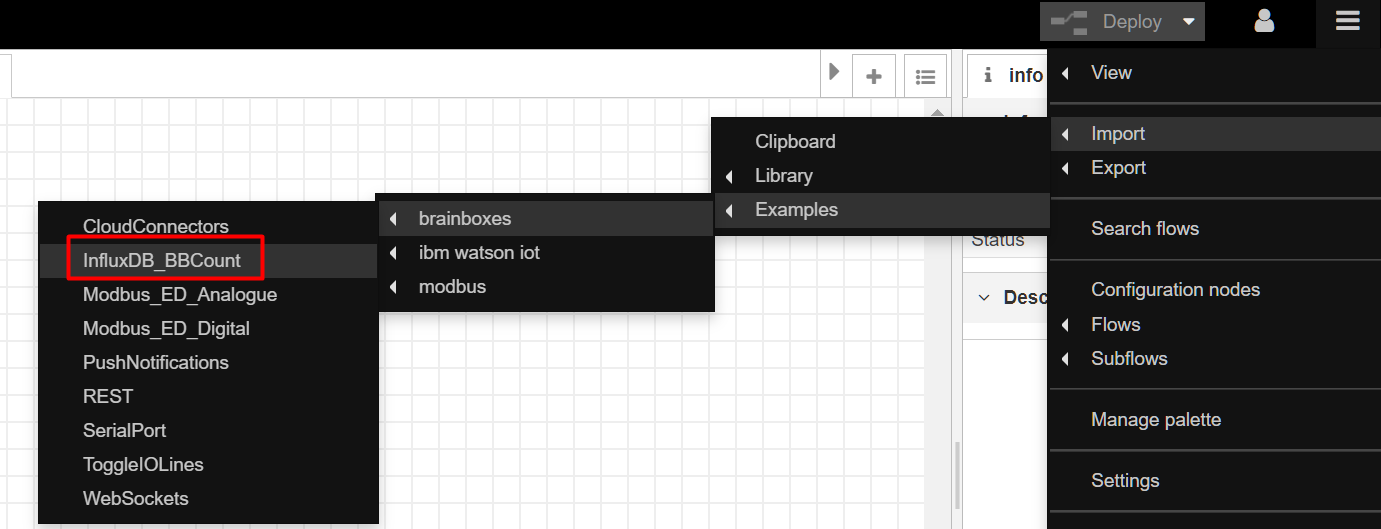
To import the Node-RED flow click on the menu in the top right-hand corner, then: Import > Examples > Brainboxes > InfluxDB_BBCount, as the screenshot below shows:
Your imported flow will look like this:
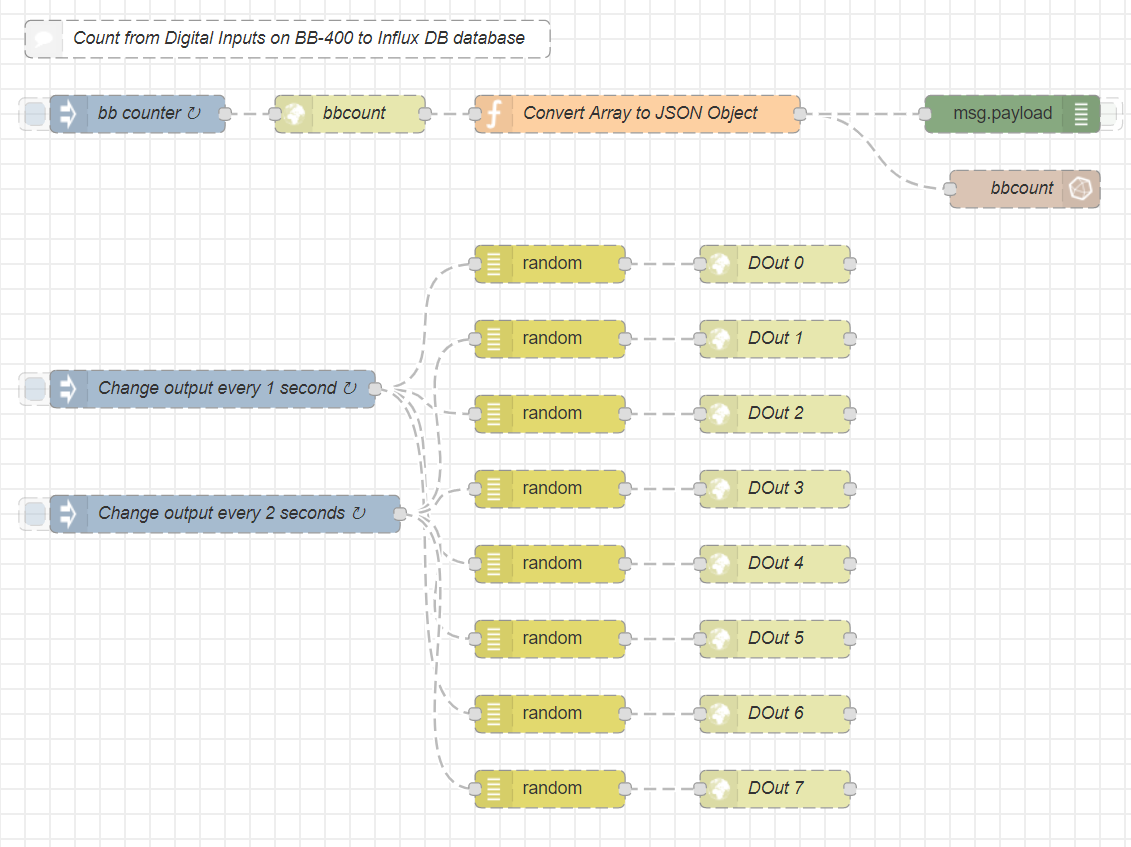
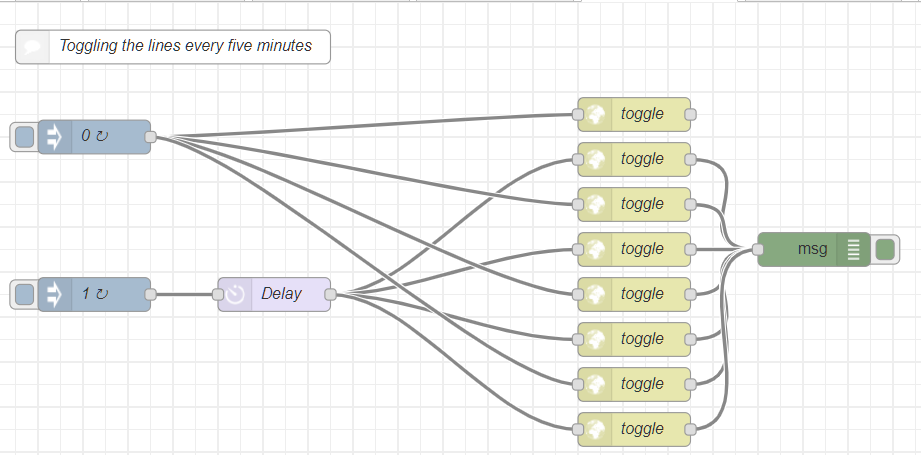
The top flow sends the IO line count to the bbcount Database in InfluxDB. The bottom flow is used to change the IO lines on and off every 5 minutes. If you want to update the IO lines quicker than this, then you can update the Delay node accordingly. If you want to update the IO lines quicker than this, then you can update the Delay node accordingly:
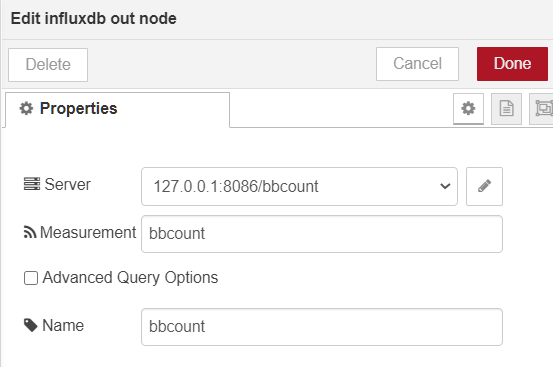
You can see the InfluxDB node  is titled 'bbcount'. This is the name of the database we will create in InfluxDB. If you would like to give your database a different name, then make sure you update the server URL by editing this node:
Now we have explained how the Node-RED flows work, we will create the database in InfluxDB and send some data over.
Creating a database in InfluxDB
You should have installed InfluxDB by this step, next run an instance of InfluxDB by running the command in a BB-400 terminal:
influx

Now create the 'bbcount' database:
CREATE DATABASE bbcount
Now run the following command to view all the databases present:
SHOW DATABASES
We want to use the bbcount database:
USE bbcount
![]()
Observing the data in InfluxDB
The database will be empty to begin with, but if we go back to our Node-RED flows and deploy both flows, then run the command below we should see some data:
SELECT * FROM bbcount LIMIT 10
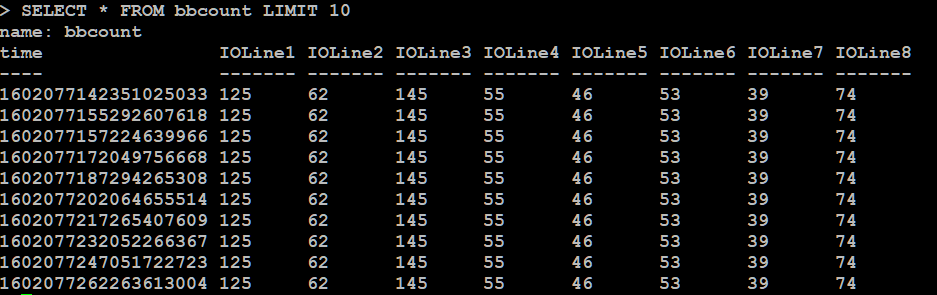
This screenshot shows the counts for each IO line over time. The columns represent the IO line, and each row is a dataset at a given time. Make sure to limit the number of values you output (e.g. LIMIT 10) otherwise when your database becomes populated with a lot of data it can take a while to load.
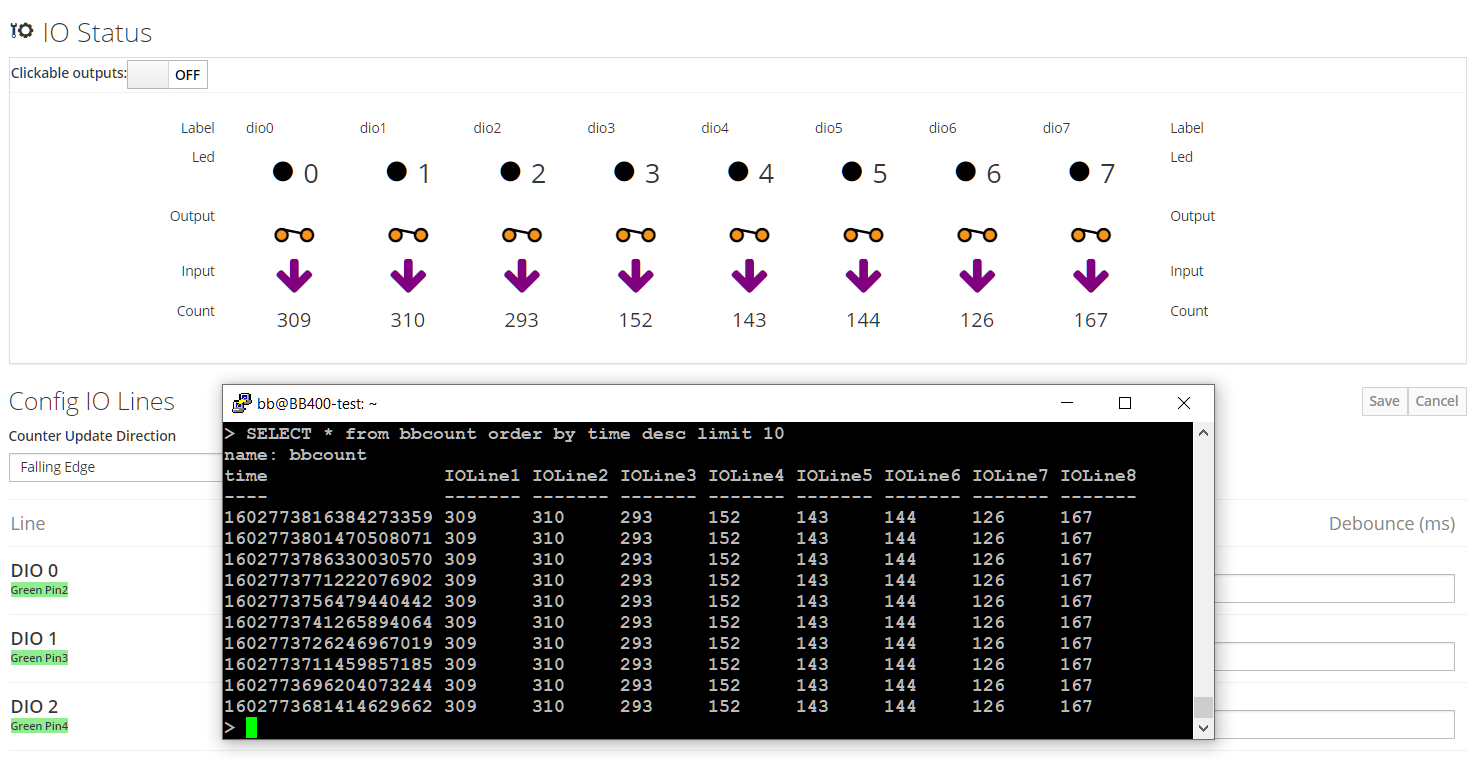
The data above is shown in ascending time, it might be useful to see the most recent changes in IO counts first, so we can use the following command:
SELECT * FROM bbcount order by time desc LIMIT 10
You can see from the image below that the IO count data matches the data we observe in the InfluxDB bbcount database:
To delete a database use:
DROP DATABASE database_name
View data on Grafana
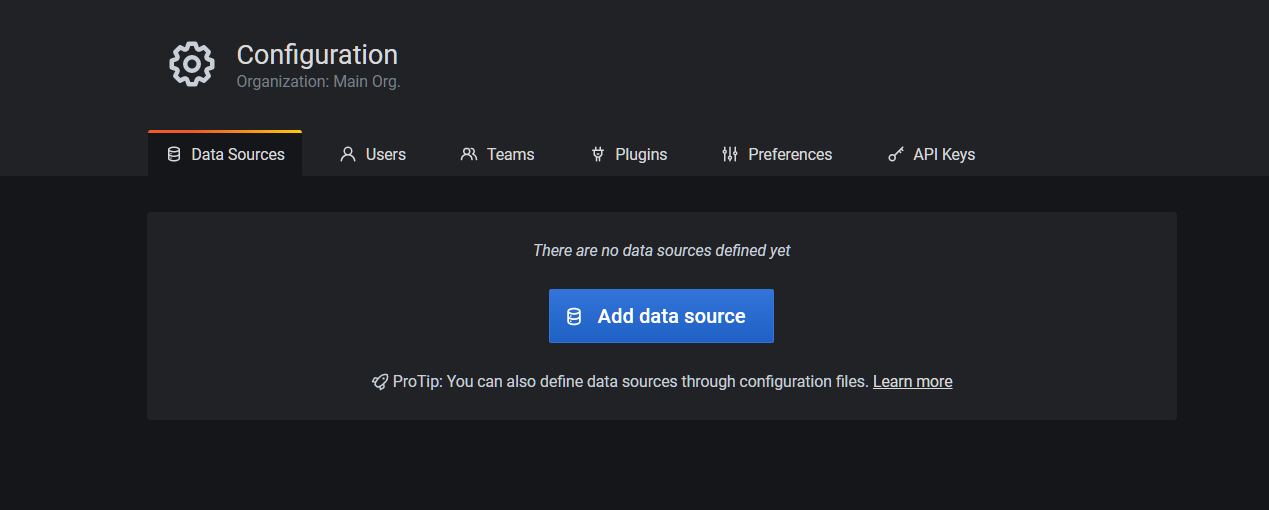
Now we have our database working, we can view this data within Grafana. Log back into Grafana. We want to add an InfluxDB data source. Click on the configuration icon and then data sources:
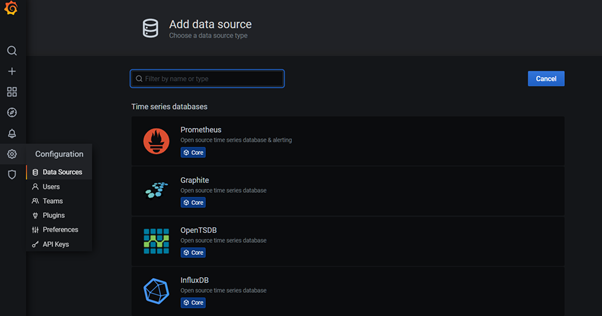
Click on the Add data source button:
Change the type to InfluxDB and provide the URL "http://localhost:8086". This URL ensures the Grafana instance is on the same IP address as your BB-400:
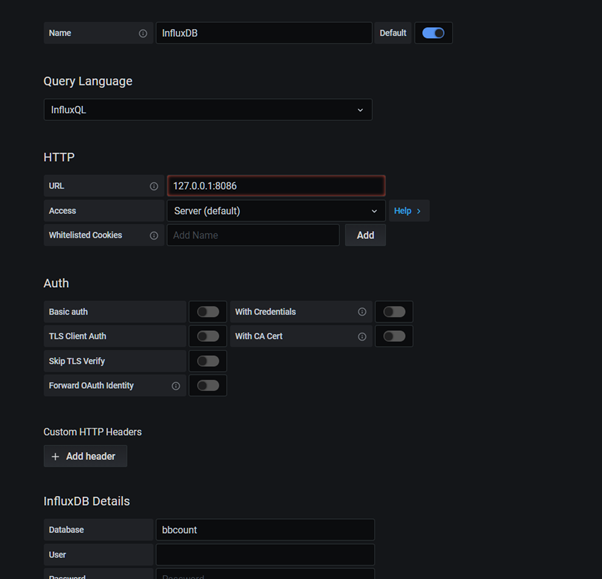
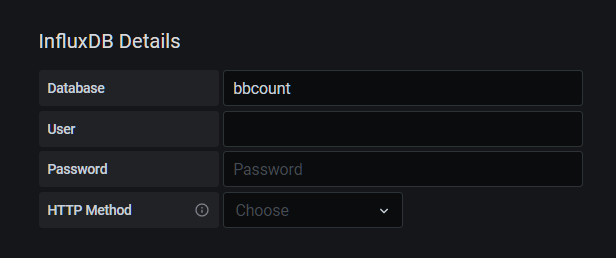
Underneath the InfluxDB Details heading, make sure you add the Database name as "bbcount":
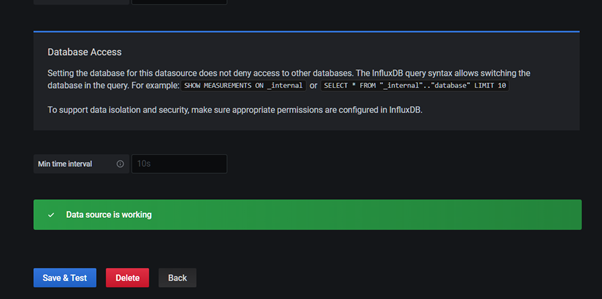
Now when you save changes you should see the following:
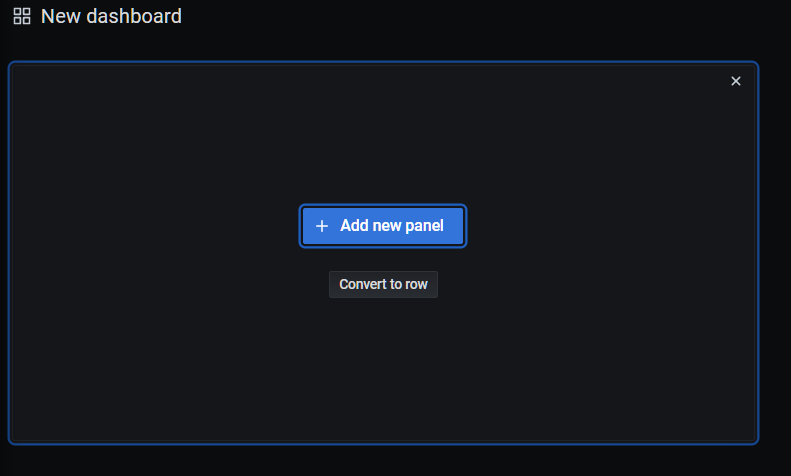
Now we can start creating some graphs. Click on the dashboard icon:

Then click on Add new panel:
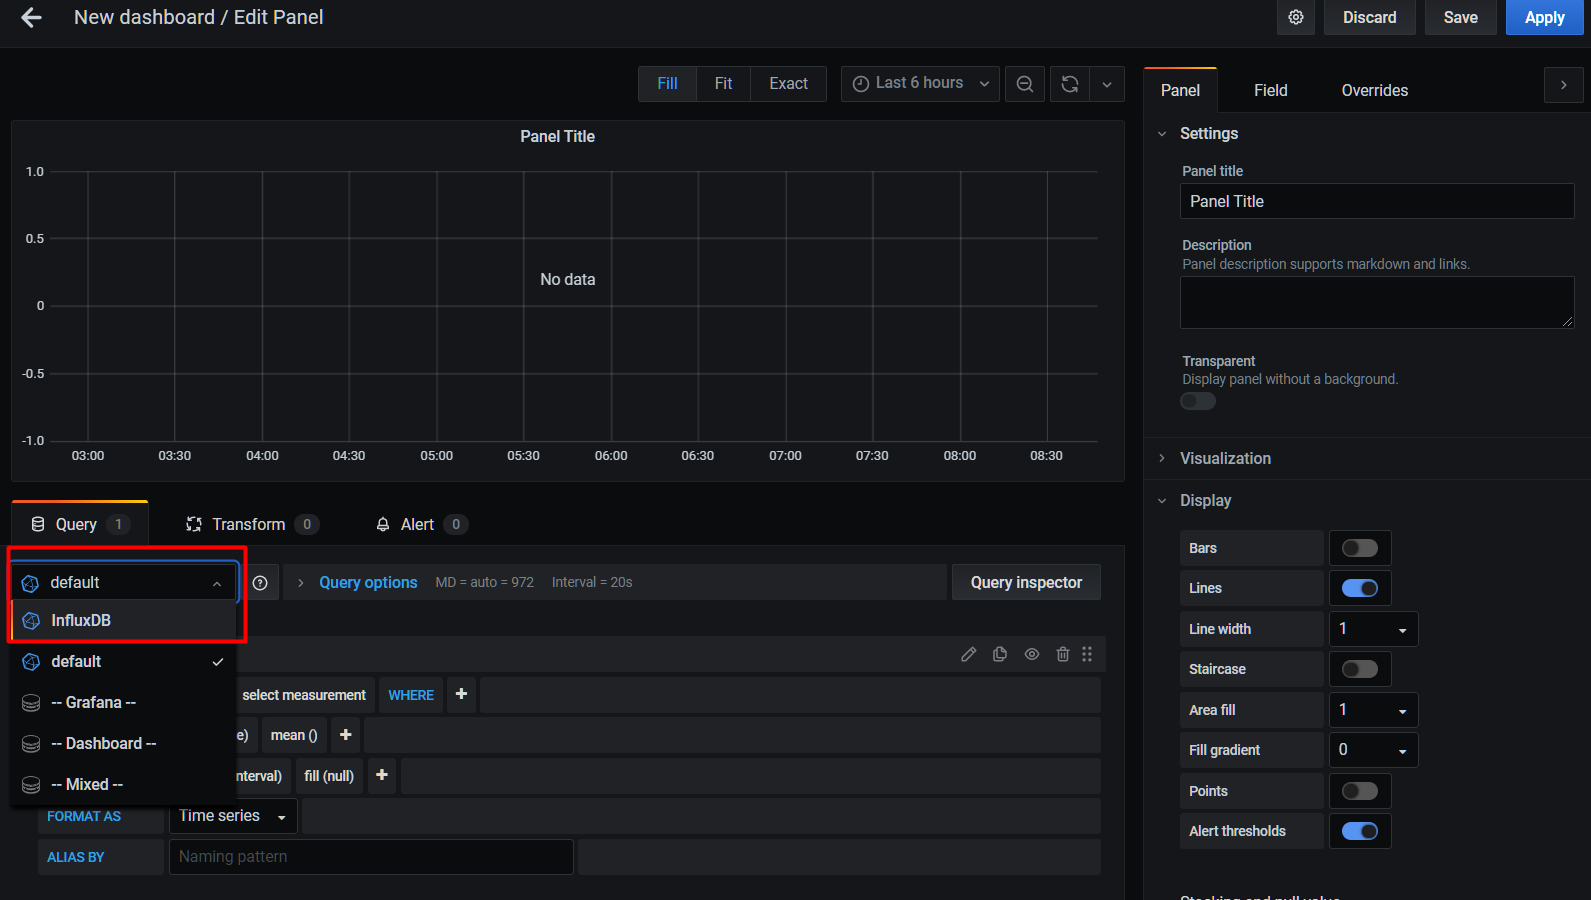
Change from default to InfluxDB:
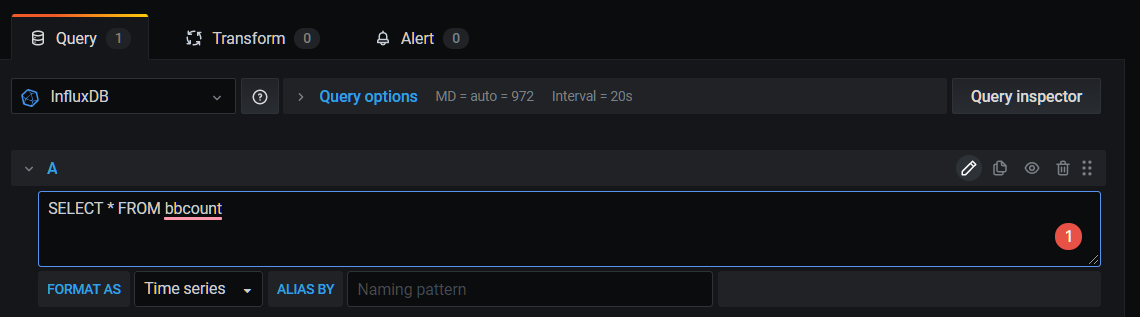
For the initial graph to see the change in all the IO counts over time, in the query section we can add a very simple query. Click on the pencil on the right-hand side, running the command in a BB-400 terminal:
SELECT * FROM bbcount
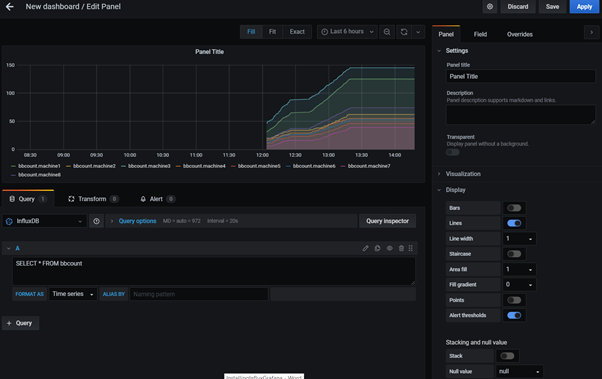
And you can see all the data is there:
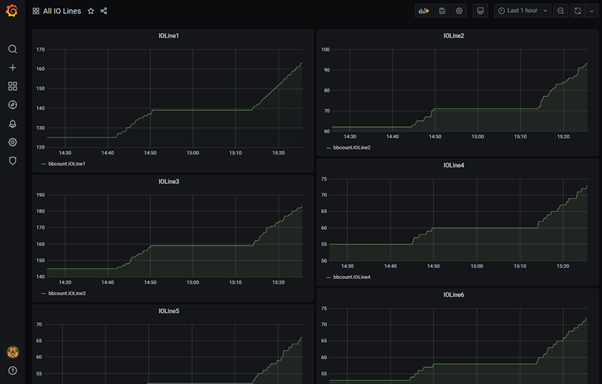
Next we can separate the data into a dashboard for each IO line. Create a new panel for each IO line and change the query to SELECT IOLineNUMBER FROM bbcount, e.g. for IO Line 1 we would use the query:
SELECT IOLine1 FROM bbcount
And we would create a new panel for each of the IO lines, until there are 8 representations like so:
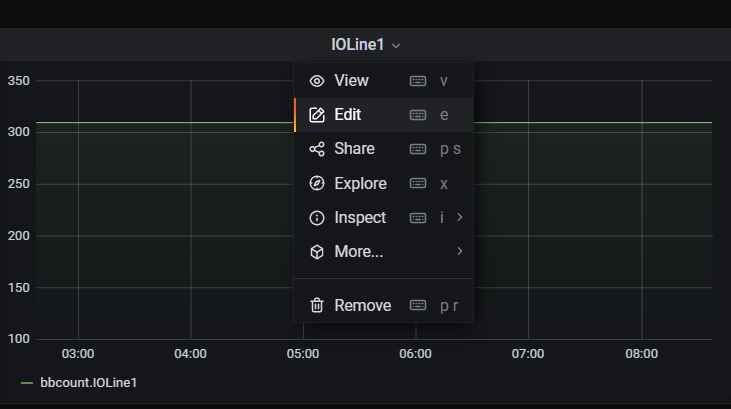
To edit an existing graph, hover over the title and click on Edit:
Conclusions
You have successfully followed this example to count the change in BB-400 IO lines, using Node-Red, send the data to InfluxDB and then visualise the changes on Grafana. Now you can adapt the database and the graphs accordingly, or continue to monitor the graphs you have created in this FAQ.