
Site survey — inventory a Brainboxes deployment with BB-Eco
You're handed the keys to a customer's network, an OT engineer's laptop, and an hour to document what's actually deployed. This guide walks through using BB-Eco to turn that into a complete, exportable inventory in under fifteen minutes — so you can hand the customer a real report instead of sketching on a whiteboard.
It works equally well for:
- First-time customer site visits — figure out what's there before you change anything.
- Pre-upgrade audits — confirm device counts and firmware versions match the customer's records.
- Periodic asset reviews — diff against last quarter's inventory; new devices show up immediately.
- Handover documentation — leaving a project? Hand the next engineer a CSV.
Before you start
- BB-Eco installed on a laptop you can plug into the site network. (See Install BB-Eco.)
- A wired Ethernet connection to the same Layer 2 segment as the devices you want to find.
- The customer's permission to passively observe the network. Active CIDR scans require the same permission for the subnets you intend to probe.
Step 1 — Plug in and let auto-discovery do its work
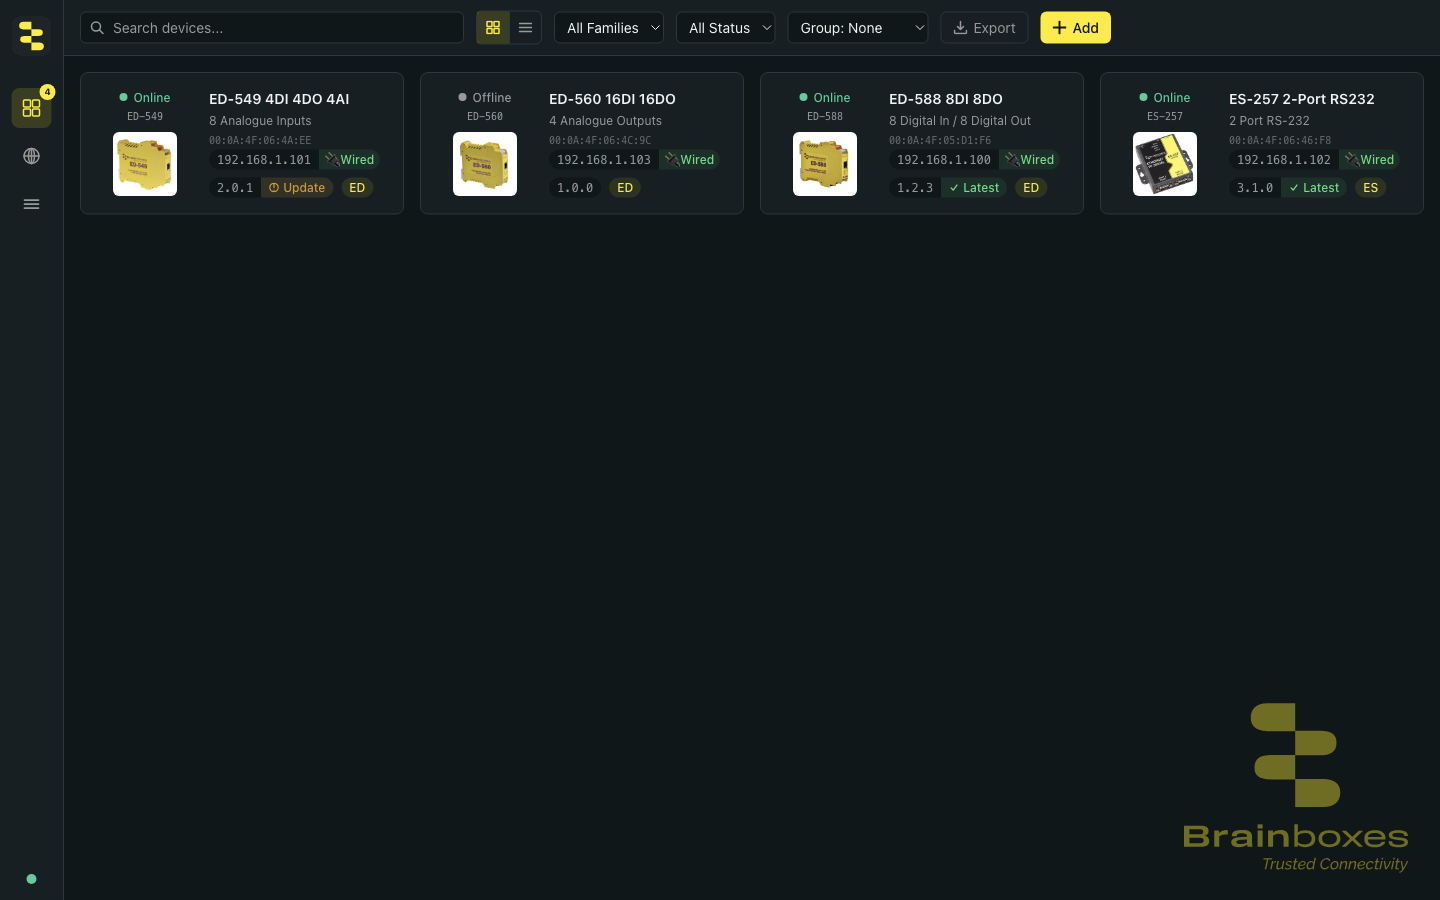
Plug your laptop into a free port on the customer's switch and open BB-Eco. Within seconds the dashboard fills with every Brainboxes device on that broadcast domain. No buttons to press, no scans to start.
If devices are missing, work through the no-devices troubleshooting checklist — usually a VPN or a cross-subnet topology.
The dashboard's top toolbar gives you the filters that matter for survey work — narrow by family or status, then Export writes a CSV you can paste straight into the report:

Step 2 — Open Network Neighborhood for the rest of the LAN
Click the Network Neighborhood icon (globe) in the left sidebar. This view lists every device on the segment that announces itself — printers, NAS, IP cameras, edge controllers, smart-home gear — using SSDP, mDNS, and WS-Discovery in parallel.
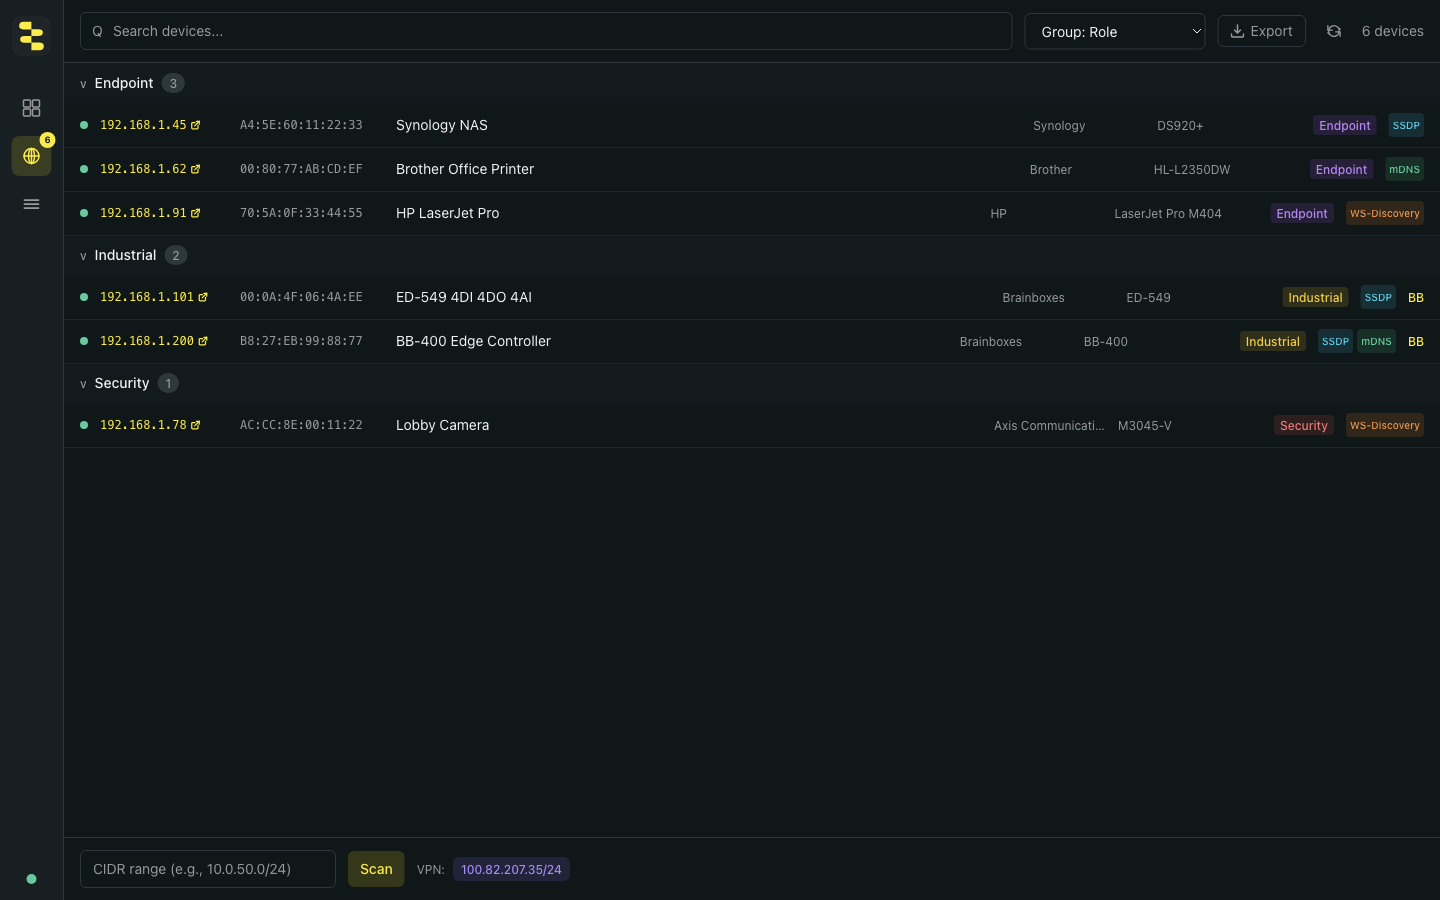
Useful for surveys because it surfaces:
- Brainboxes devices the dashboard misses — different VLAN, manual IP, you name it. The Neighborhood is broader than the main dashboard.
- Adjacent infrastructure — the customer's NAS, printers, cameras. Often the customer didn't know either.
- Anomalies — anything you don't recognise is worth flagging.
See Use BB-Eco as a network discovery tool for the full Neighborhood walkthrough.
Step 3 — Cross-subnet? Run a CIDR scan
Auto-discovery only sees the broadcast domain you're plugged into. If the site has multiple subnets you can scan them actively from the bottom of the Neighborhood tab — enter the CIDR (e.g. 10.50.0.0/22) and click Scan. BB-Eco TCP-probes every host on common HTTP/HTTPS ports and enriches each responder with its Server header and page title.
A /22 subnet (1024 hosts) takes about a minute. A /24 is under fifteen seconds. Cancel any time; partial results are kept.
Active CIDR scans send TCP probes. On production OT networks, customer sites without authorisation, or anywhere with intrusion detection, don't run a CIDR scan without sign-off. The passive Neighborhood view is fine — it only listens.
Step 4 — Capture configuration baselines for the Brainboxes devices
While you have access, capture a per-device template for every Brainboxes unit you found. From the desktop app open the device's detail panel → Template tab → Export. Or from the CLI:
bb-eco template export 192.168.1.50 surveys/customer-x/ed-549-ip-50.json
These JSON files become:
- The before picture for any future change you make.
- The drift baseline for ongoing audits — see Detect configuration drift.
- A handover artefact — committed to Git, the customer's IT team can reproduce the device's exact configuration on a replacement unit if it ever fails.
Capturing templates is a read-only operation; nothing on the device changes.
Step 5 — Export the inventory as CSV
In Network Neighborhood, click Export in the toolbar. You get a CSV with every column visible in the UI plus the discovery-source list (semicolon-separated when a device announced on multiple protocols).
The Brainboxes-only dashboard has a separate Export button that saves a more detailed CSV — model number, MAC, IP, firmware version, capabilities, last-seen timestamp.
A typical site-survey output looks like:
mac,ip,model,firmware,family,interface,deviceState,lastSeen
00:0A:4F:06:4A:EE,192.168.1.101,ED-549,2.0.1,ED,en0,Online,2026-05-06T15:42:12Z
00:0A:4F:06:46:F8,192.168.1.102,ES-257,3.1.0,ES,en0,Online,2026-05-06T15:42:12Z
00:0A:4F:06:4C:9C,192.168.1.103,ED-560,1.0.0,ED,en0,Offline,2026-05-06T15:38:57Z
B8:27:EB:99:88:77,192.168.1.200,BB-400,4.2.1,BB,en0,Online,2026-05-06T15:42:12Z
Drop the file into the customer's report, an asset-management database, or a Git repo for versioned site records.
Step 6 — Cross-reference firmware against the latest release
The dashboard's Firmware filter highlights anything with an outdated build. For a written report, the CLI gives you the same info in JSON:
bb-eco firmware status --json | jq '.[] | select(.updateAvailable) | {model, ip, current: .currentVersion, latest: .latestVersion}'
Output is a clean list of upgrade candidates that you can attach to your report or paste into a maintenance ticket.
Step 7 — Hand over what you have
What a complete site survey deliverable looks like:
| Artifact | Source | Format |
|---|---|---|
| Device inventory | BB-Eco dashboard or bb-eco list --csv | CSV — model, IP, MAC, firmware, last seen |
| Adjacent network inventory | Network Neighborhood Export button | CSV — every announcing device on the segment |
| Configuration baselines | bb-eco template export per device | JSON files, one per device, in Git or a shared drive |
| Firmware-update list | bb-eco firmware status --json | JSON or CSV — devices needing attention |
| Network topology notes | Your own observations | Plain text — VLAN, switches, VPN, routing oddities |
| Photos | Your phone | JPG — physical install, panel layouts, label readability |
Together these tell the customer not just what's there, but where the risks and opportunities are.
Tips from the field
- Plug into the customer's switch, not their access point. Wi-Fi access points often don't bridge multicast cleanly, and SSDP is multicast.
- Run the CIDR scan before lunch. It takes a minute on a
/22. While you eat, the report writes itself. - Capture templates before any maintenance. If you upgrade or reconfigure first, the baseline reflects the new state, not the original.
- Check the timestamps on offline devices. A device last seen 6 months ago is probably retired; a device last seen 30 minutes ago is intermittent.
- Save your survey directory to Git. Future-you will need it; future-you will not remember what was on screen today.
More resources
- Use BB-Eco as a network discovery tool — the Neighborhood view in depth
- Discovery, the device cache, and VPN sessions — administer remote sites over a VPN
- Detect configuration drift — the periodic-audit follow-up after the initial survey
- BB-Eco CLI reference — every command, every flag, every output format
- General troubleshooting with BB-Eco — when something on the survey doesn't add up